
CASE STUDY
A new survey system for a global event business.
A global event business runs flagship events around the world, each drawing VIP guests, the corporate clients who pay to take part and thousands of members of the public. Each audience was being surveyed in an inconsistent way, so results were hard to compare or track.
We now run the surveys after every event: one shared format, three audiences, and a report for each that feeds straight into the business's performance tracking.
AT A GLANCE
The results
surveys designed to measure the business's master strategy objectives, one for each audience.
improvement in survey response rate.
audiences: every VIP guest, client and visitor gets a say after every event, and their feedback shapes what happens next.
oUR APPROACH
What we did
Audited every survey
We reviewed past surveys for structure, response rates and effectiveness, then cut, rewrote or added questions.
Tied questions to strategy
Key questions now map to the business's long-term strategic objectives and the metrics in its monthly performance tracker.
Brought every team in
Marketing, VIP, partnerships and sustainability teams feed in questions and sign off before each survey goes live.
Wrote the invitations
Three emails per audience, an invitation and two reminders, with A/B-tested wording to lift response.
Cleaned up the client data
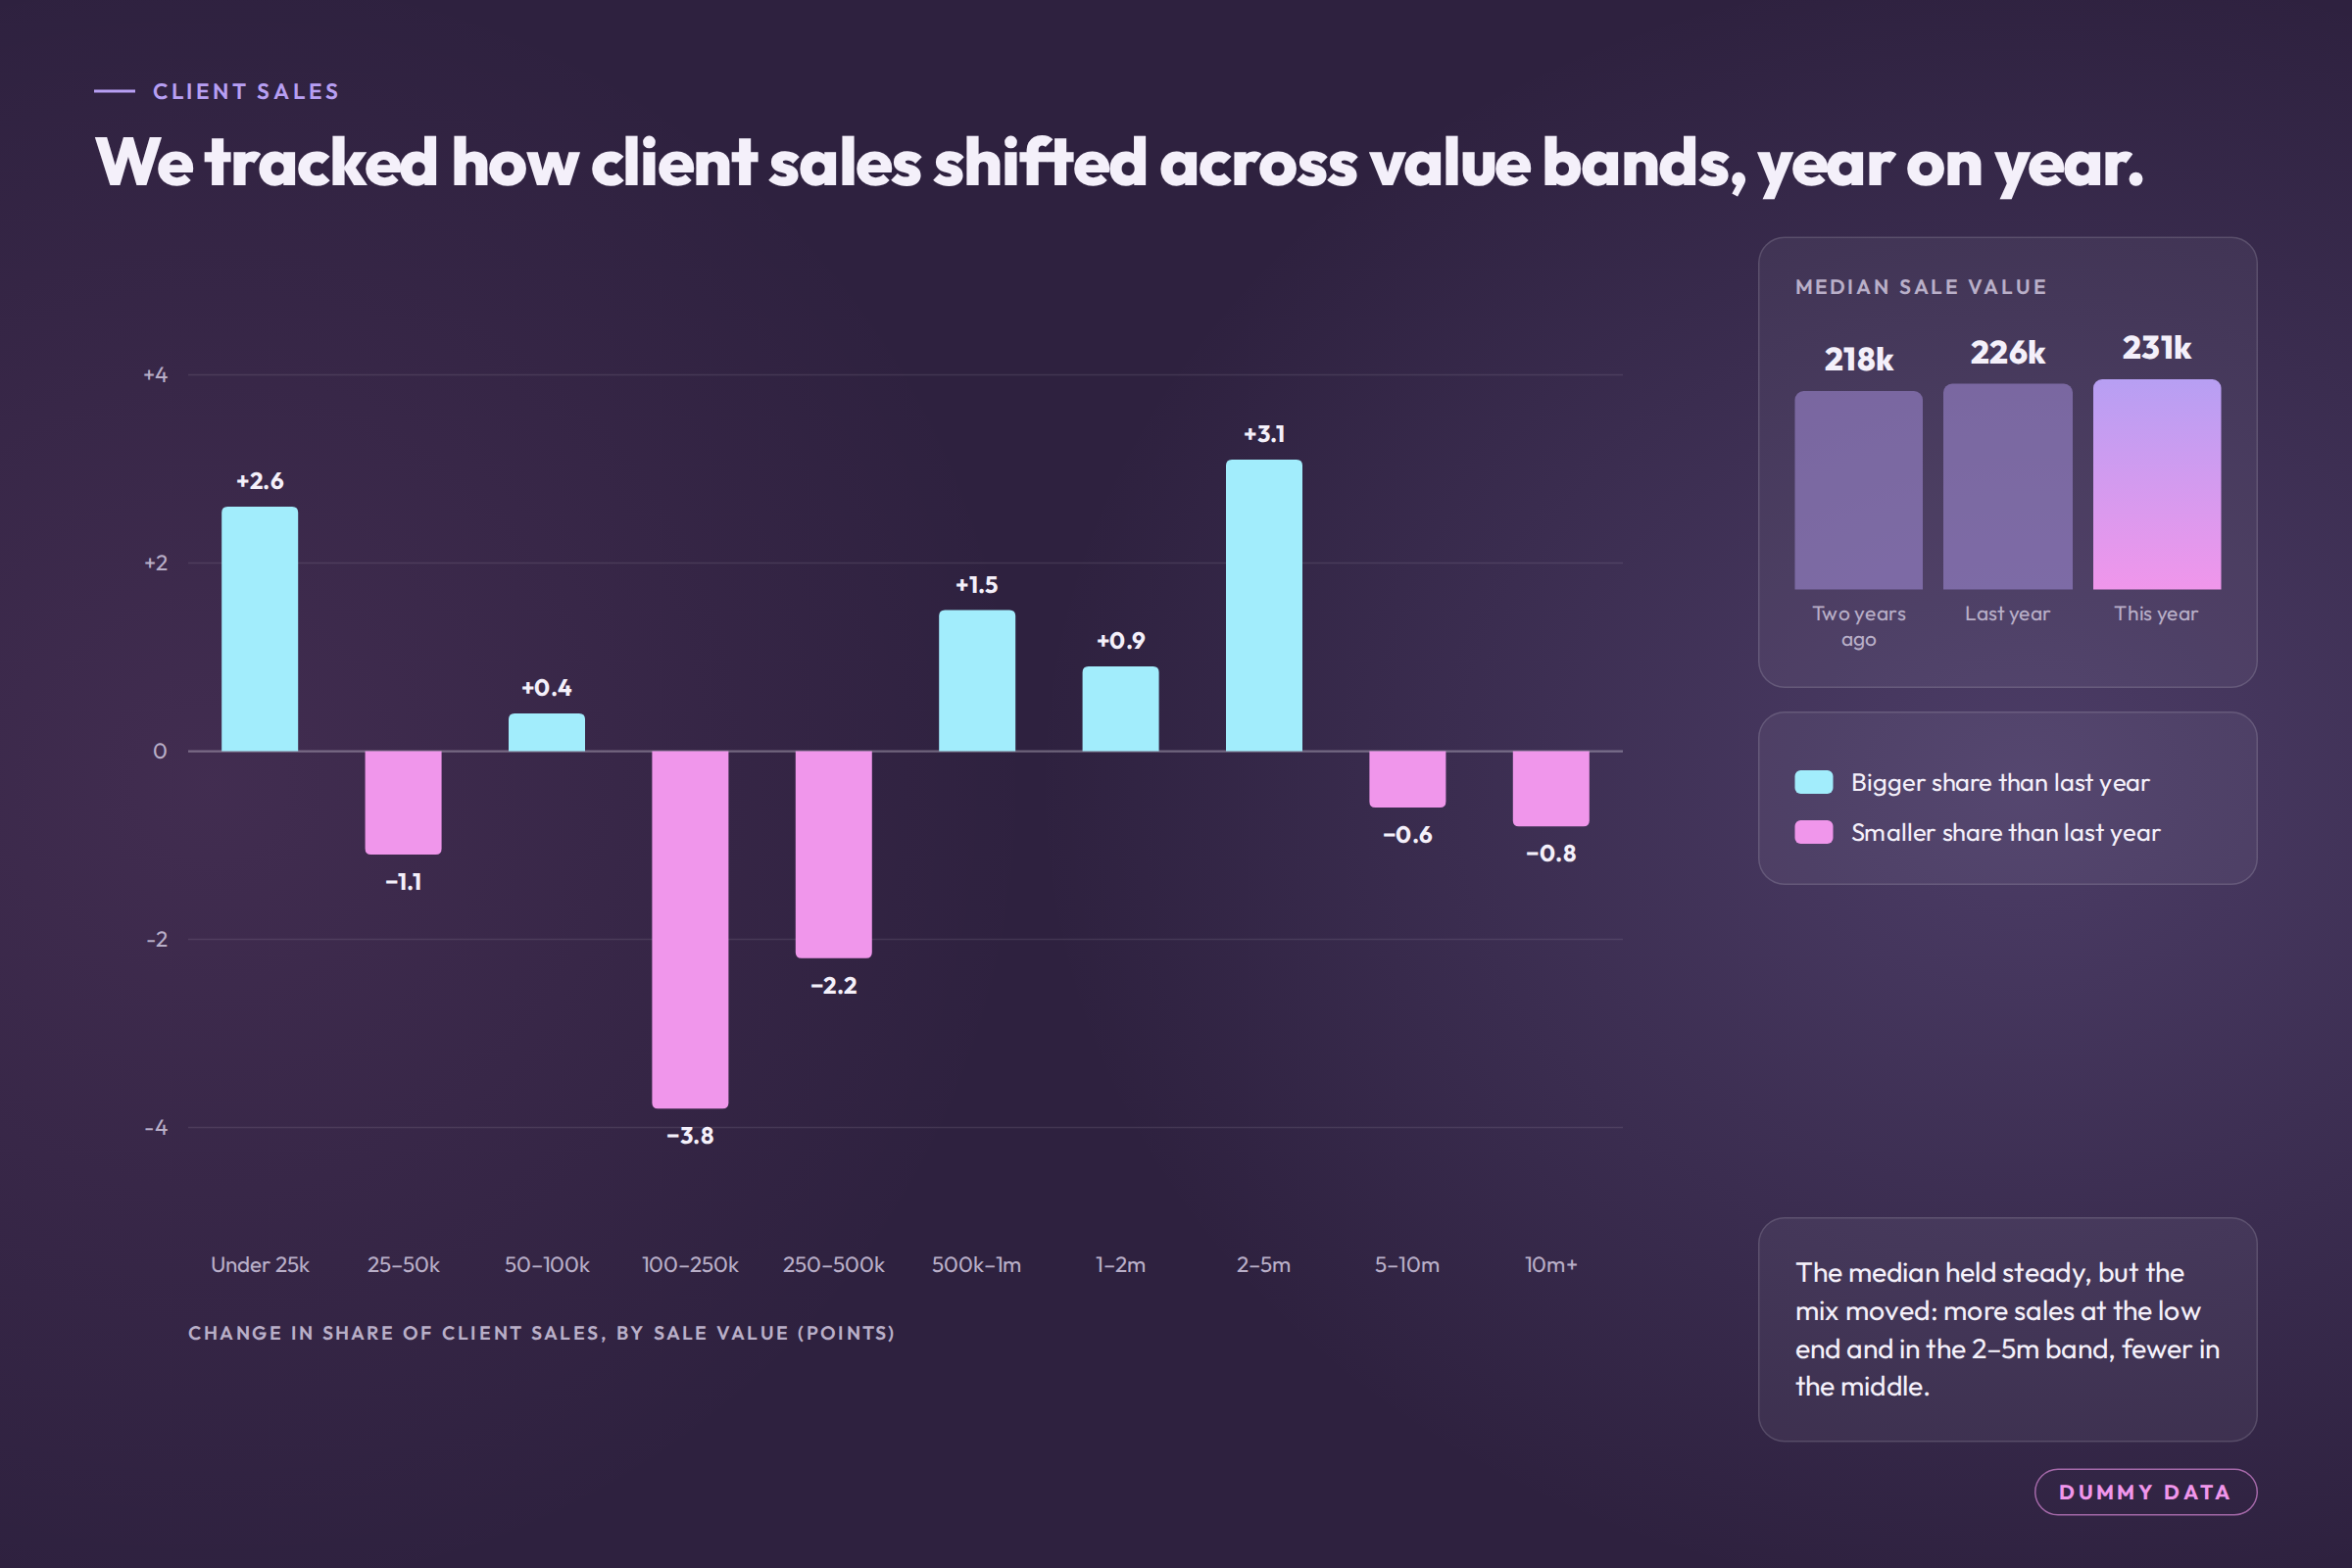
Named responses let us group clients by size, chase non-respondents and remove duplicates, while keeping answers confidential.
Tiered the respondents
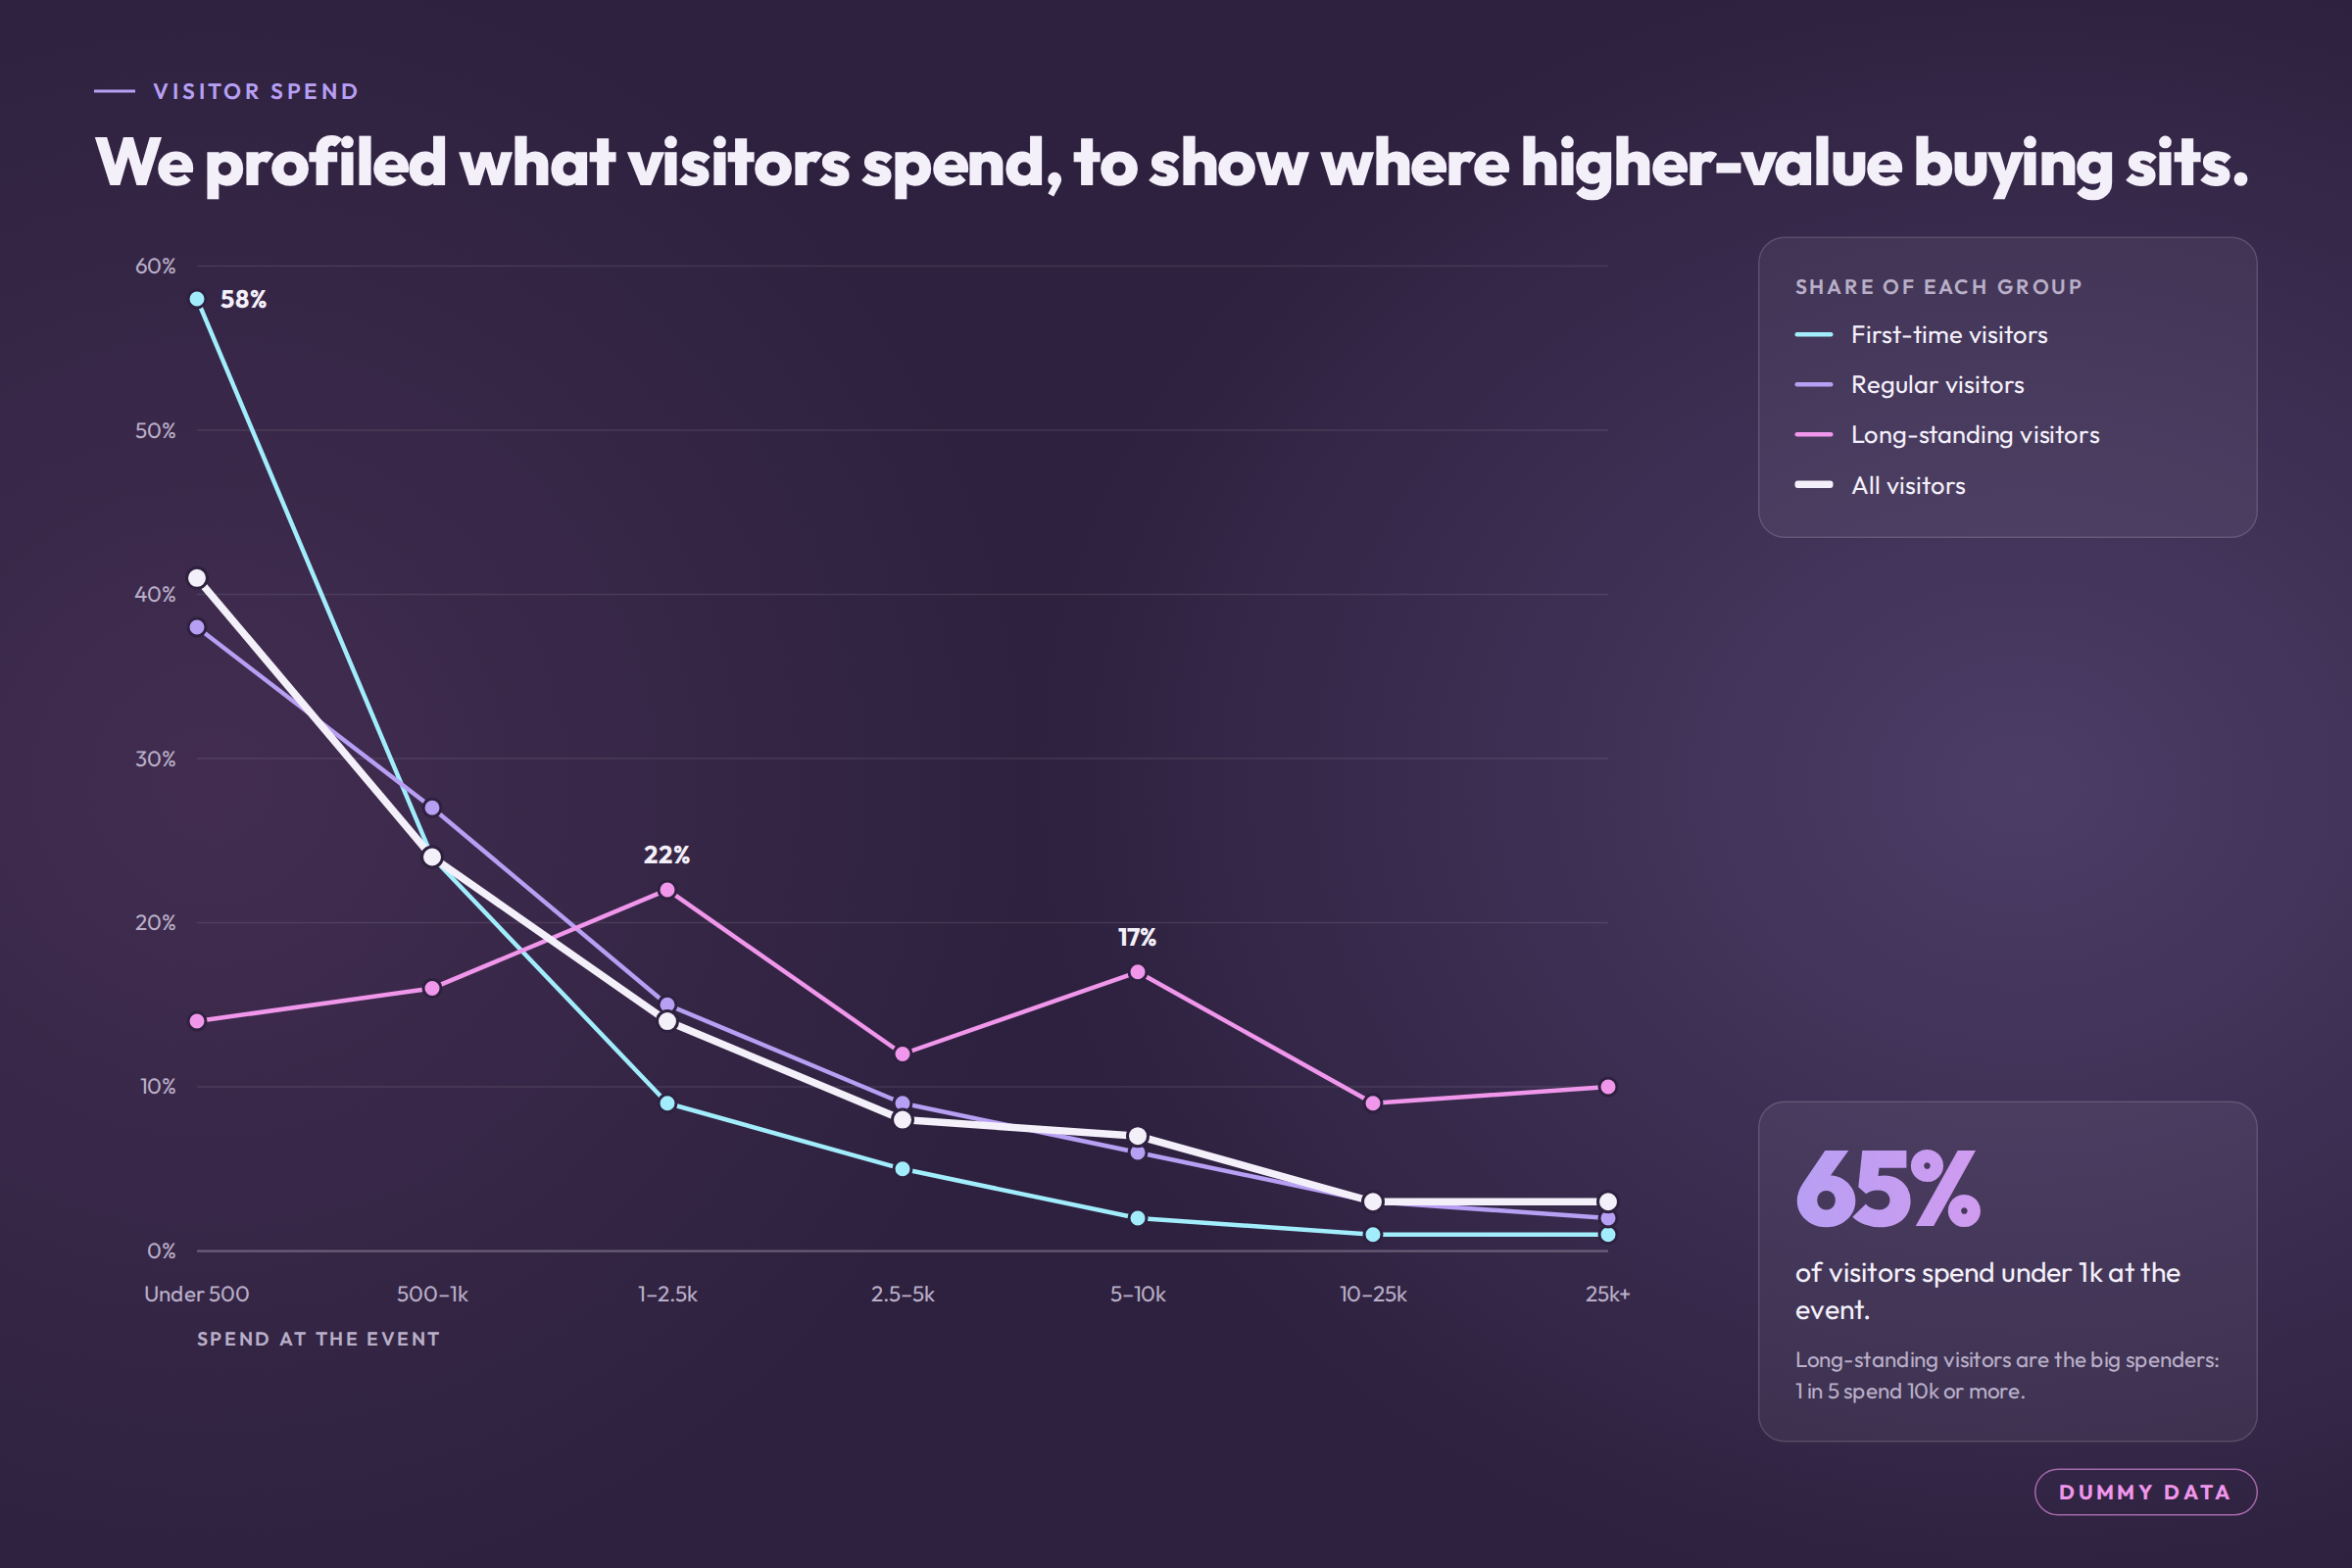
We used profiling questions to segment responses, so results show what matters most to the highest-value guests.
THE OUTCOME
Insight built for decisions
Three reports building one picture
An executive insight report for each audience, cross-referenced to show where VIPs, clients and the public agree and where they don't.
Priorities ranked by impact
Every report ranks the issues raised by priority and commercial impact, so teams know what to fix first.
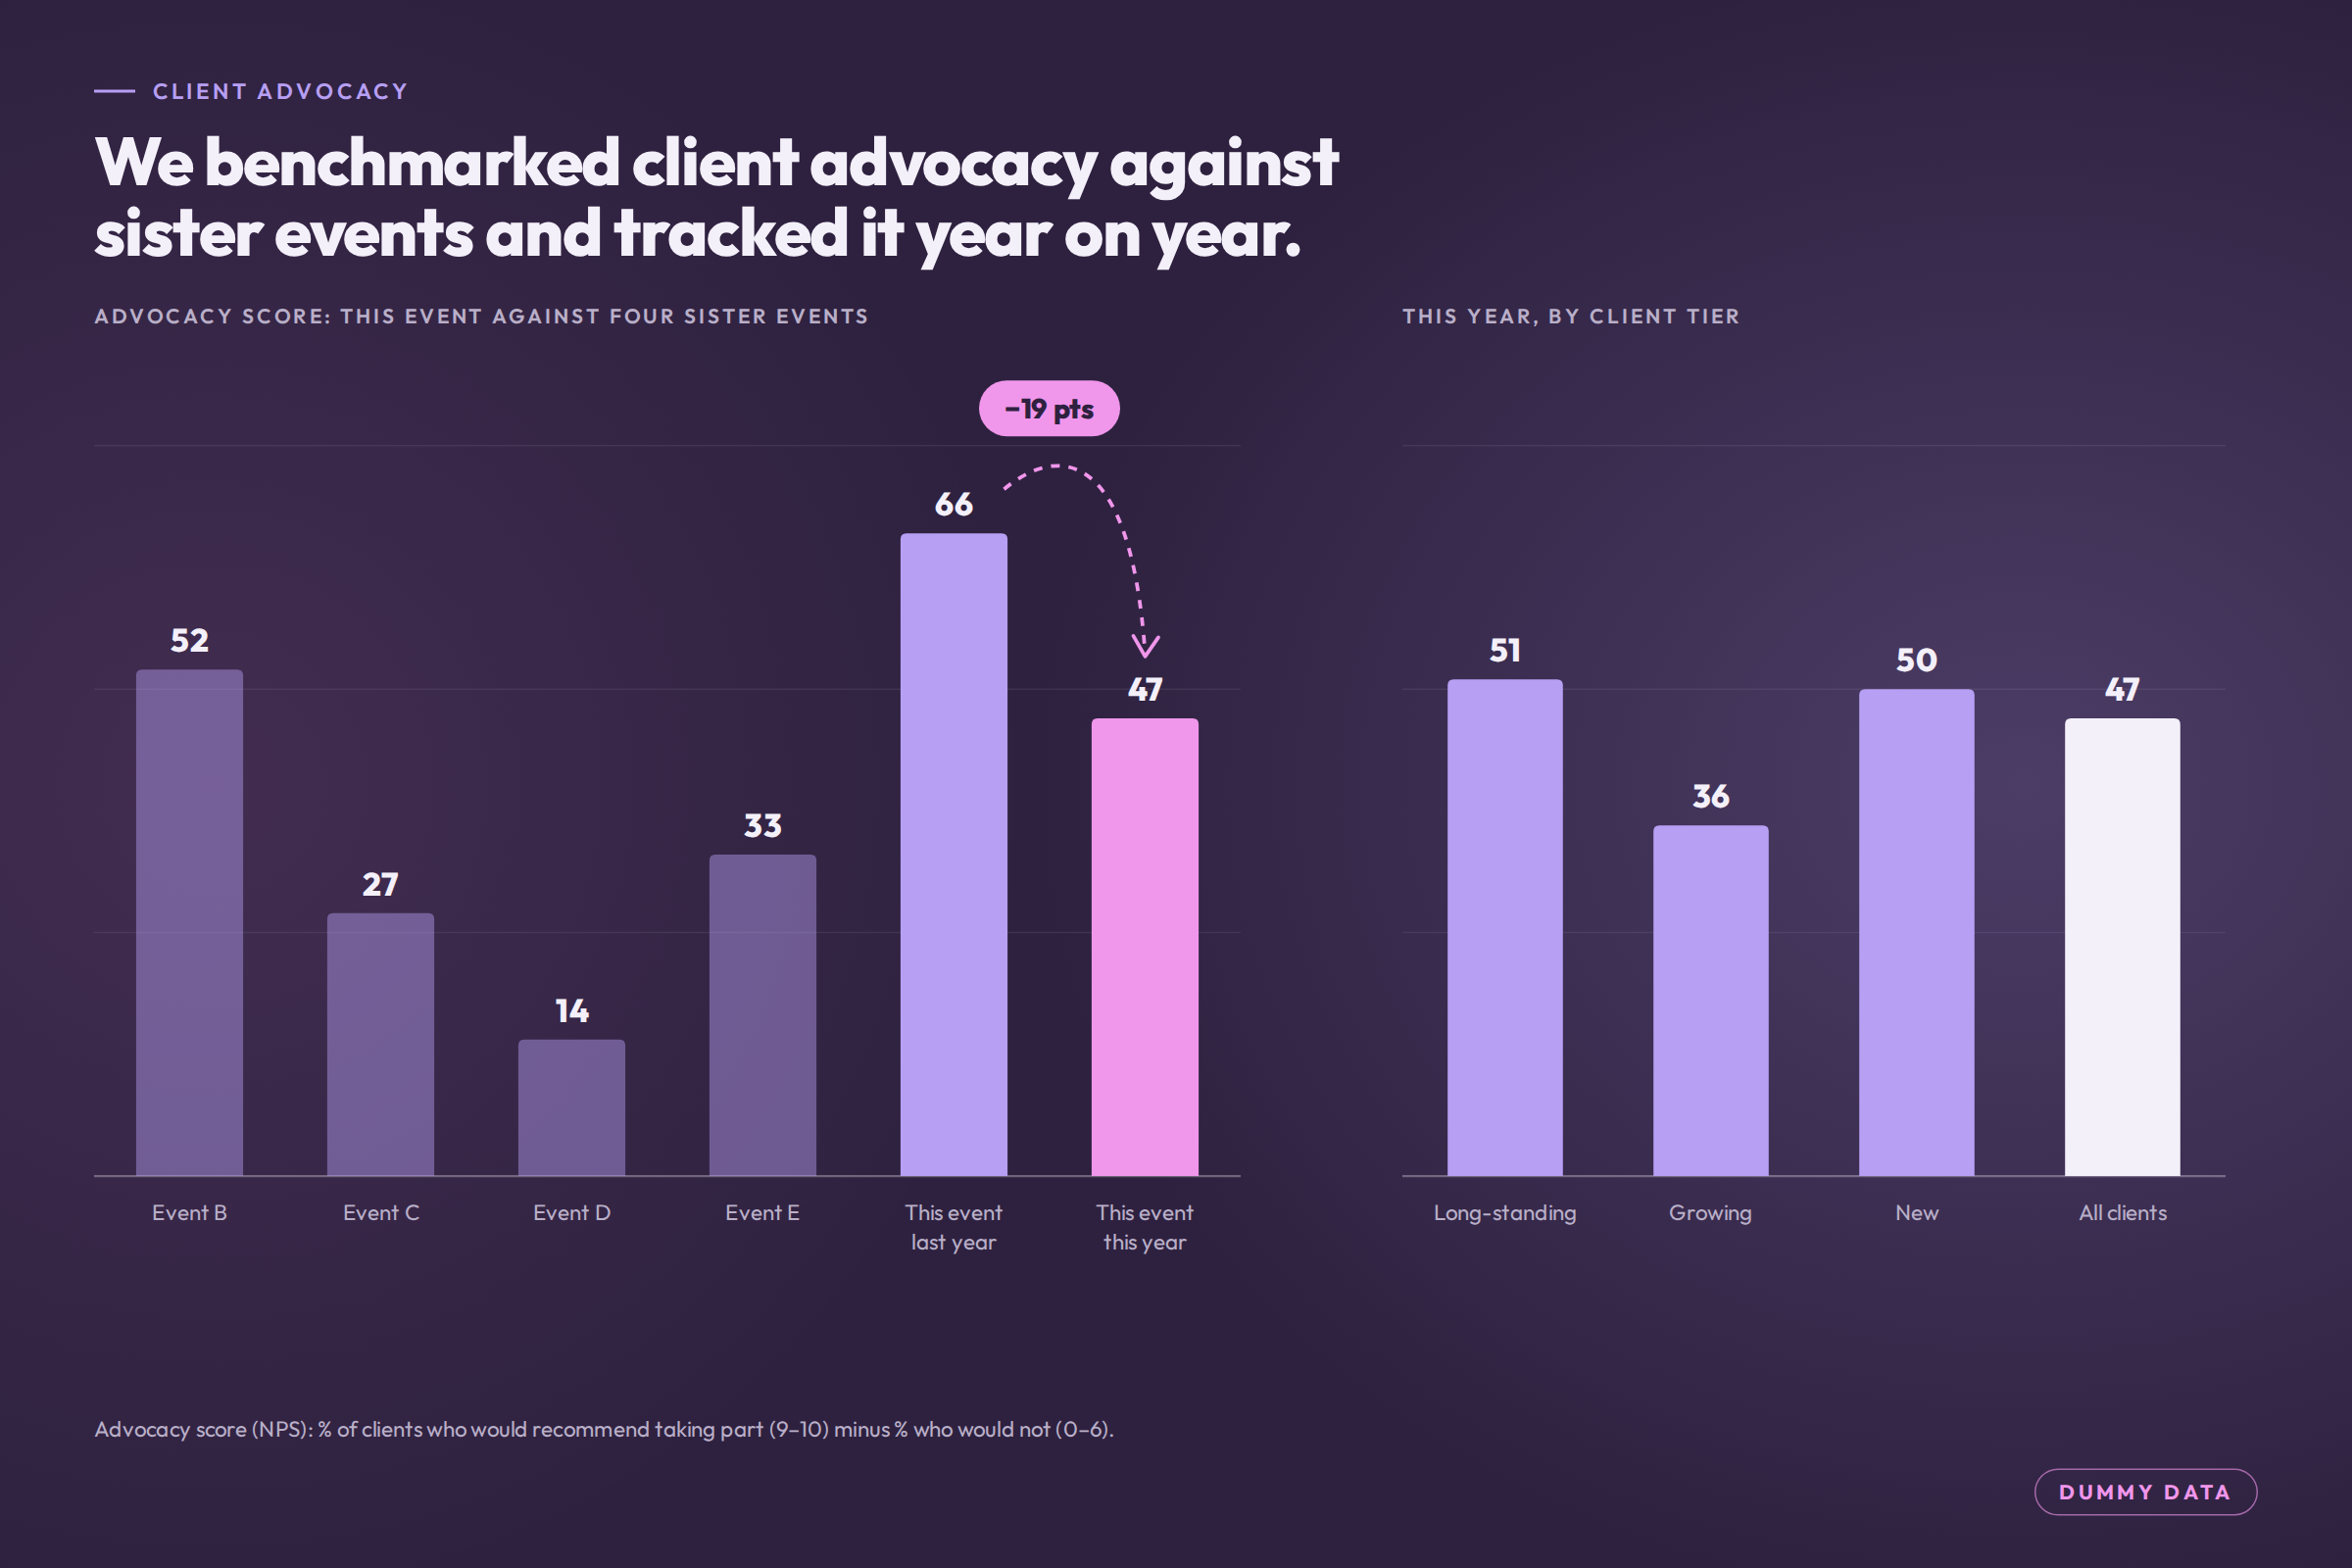
Early warnings on advocacy
Ability to track advocacy among all audiences, analyse reasons behind movement, and build strategic fixes.
Uncovering largest gaps
Mapping importance vs performance for key areas has shown where to invest, what to protect, and what to de-prioritise.
Proof of investments
Ability to show where investments and changes across the company have directly impacted audience sentiment, NPS and likelihood to return.
A tracker that builds over time
Each event adds a like-for-like data point, building year-on-year and event-to-event benchmarks.
Ready when you are